Chasing the Lights
By Alan Dyer
|
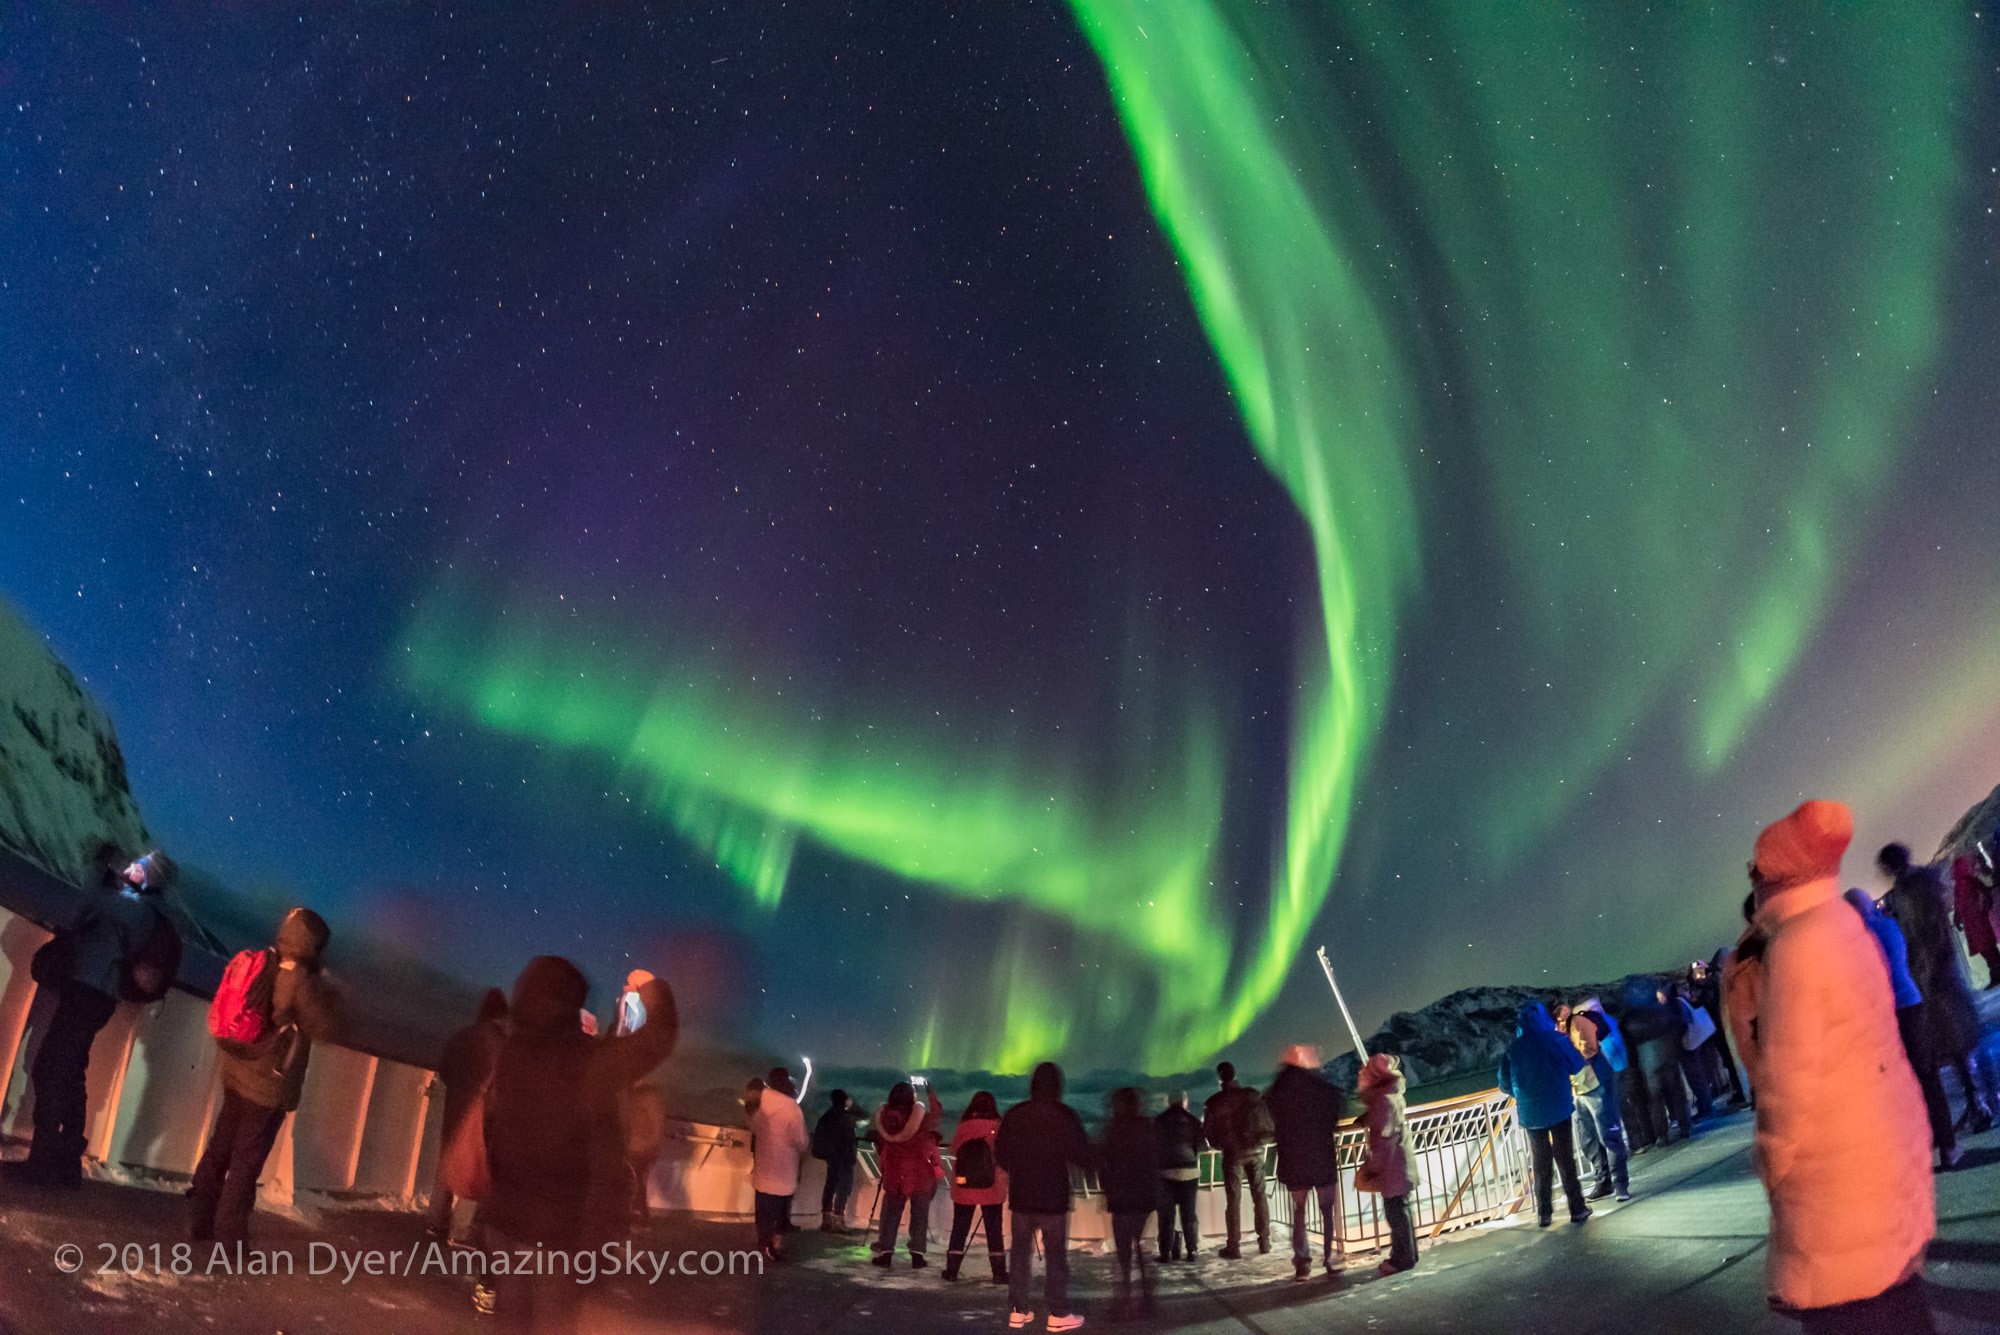
Aurora tourists take in a show in Norway from deck of the ms Nordnorge in March 2018, on one of the aurora cruises offered by the Hurtigruten ferry and cruise line. |
|
Few sky sights inspire us as does the aurora. The northern hemisphere version, the aurora borealis, is the most accessible, sparking a popular trade in aurora tourism. Even those with little interest in stargazing place seeing the Northern Lights high on their life-long “bucket list” of experiences. I’m fortunate to live in western Canada, where the zone in which auroras are seen most often – the auroral oval – dips farthest south on the planet. I see auroras several times a month from my rural backyard, though most might be dim displays. For those farther south, any show of Northern Lights is a less common, if rare, sight. As the Sun continues to decline in activity during its current once-a-decade “solar minimum,” bright and widespread displays of Northern Lights trigged by solar storms will become less frequent. That will certainly be the case from the latitudes of the northern United States, northern Europe, and even from much of populated southern Canada. Increasingly, aurora chasers will have to travel farther afield, to the north, to where the auroral oval normally resides. From the choice regions under the oval, Northern Lights can be a nightly sight, even during the depths of solar minimum. The prime locations include far northern Norway, Sweden and Finland, anywhere in Iceland, in Alaska and, in my home country of Canada, Churchill, Yellowknife, and Whitehorse. All these locations cater to aurora tourism, with tours and lodges geared to providing the “bucket list” experience. While traveling north in summer might be attractive for the warm weather, you won’t see the Lights. The night sky will be too bright, perhaps lit by a midnight Sun from locations above the Arctic Circle (latitude 66° North) around the June summer solstice. Aurora season at northern sites often doesn’t begin until late August at the earliest. While autumn might be a great time to go, check the weather prospects at your intended destination. You might find that the depths of winter offer the clearest skies. For many locations February and March are the prime aurora months, not because the Lights are more active but because the cold winter nights bring the clearest skies and best sighting chances. If you travel north, do so with realistic expectations. During a week-long stay you might get clear skies on only one or two nights, though cold Arctic sites generally have better odds. But then the Lights also have to perform. They are present on most nights under the oval, but might be dramatically bright and active on only one night of your stay, if that. Even then, don’t expect to see the range of colors depicted in photographs. The long exposures of cameras bring out the deep reds that the eye isn’t sensitive to. But when bright, auroras do look green, with perhaps a lower fringe of pink, even to the eye. And the eye is much better than most cameras at seeing the motions of the curtains, which can ripple and wave across the sky in patterns that defy explanation and belief.
|
|
|
|
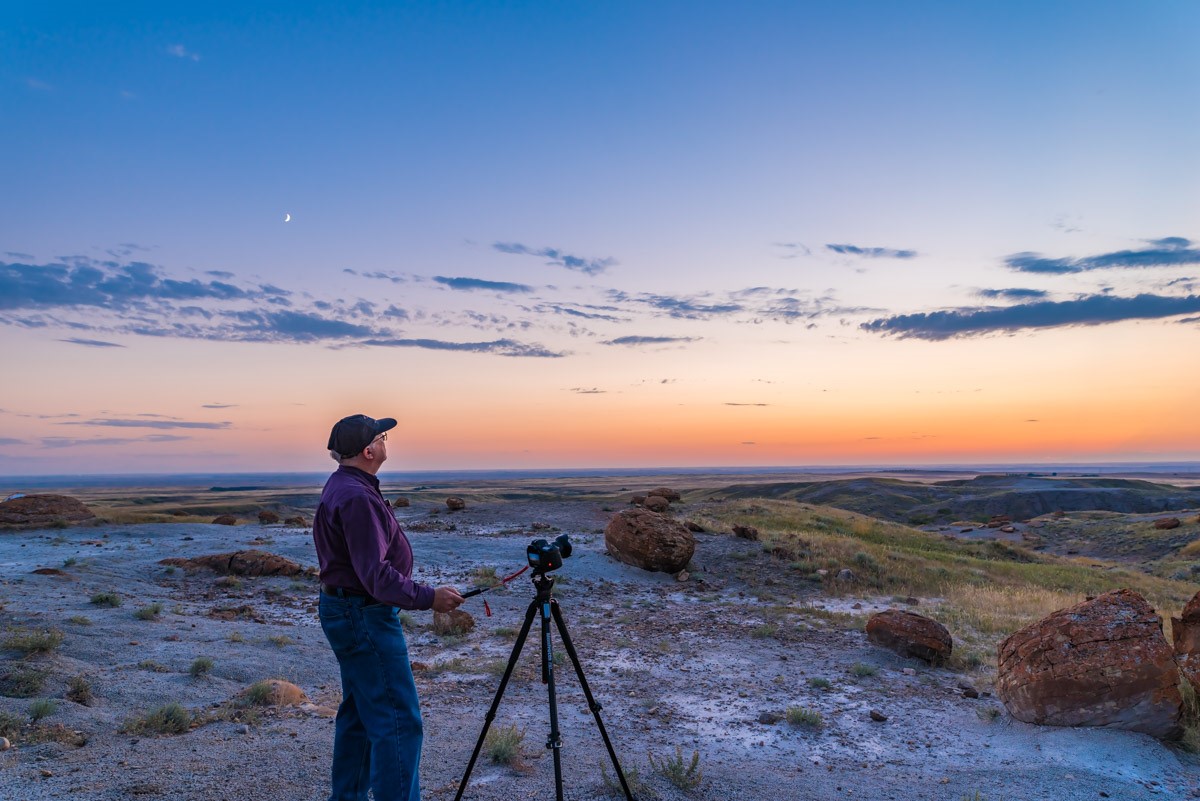
Alan Dyer is an astronomy author and photographer living in southern Alberta, Canada. He serves as a contributing editor to SkyNews and Sky and Telescope magazines, and is author of several print and ebooks on astronomy and astrophotography. Asteroid 78434 is named for him. More info can be found on his website.
|
 |
Discovering the Elementary Connection Between Stars and Us
By Megan Watzke, Kimberly Arcand, and Peter Edmonds
|
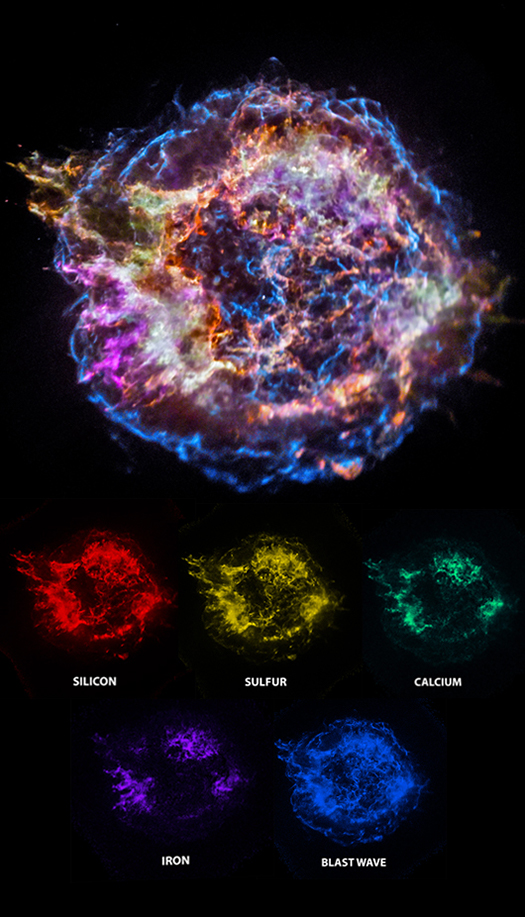
Where do most of the elements essential for life on Earth come from? The answer: inside the furnaces of stars and the explosions that mark the end of some stars' lives. Astronomers have long studied exploded stars and their remains — known as "supernova remnants" — to better understand exactly how stars produce and then disseminate many of the elements observed on Earth, and in the cosmos at large. Due to its unique evolutionary status, Cassiopeia A (Cas A) is one of the most intensely studied of these supernova remnants. A recent image from NASA's Chandra X-ray Observatory shows the location of different elements in the remains of the explosion: silicon (red), sulfur (yellow), calcium (green) and iron (purple). Each of these elements produces X-rays within narrow energy ranges, allowing maps of their location to be created. The blast wave from the explosion is seen as the blue outer ring. |
A Chandra image shows the location of several elements produced by the explosion of a massive star. Credit: NASA/CXC/SAO |
|
X-ray telescopes such as Chandra are important to study supernova remnants and the elements they produce because these events generate extremely high temperatures — millions of degrees — even thousands of years after the explosion. This means that many supernova remnants, including Cas A, glow most strongly at X-ray wavelengths that are undetectable with other types of telescopes. Chandra's sharp X-ray vision allows astronomers to gather detailed information about the elements that objects like Cas A produce. For example, they are not only able to identify many of the elements that are present, but how much of each are being expelled into interstellar space. The Chandra data indicate that the supernova that produced Cas A has churned out prodigious amounts of key cosmic ingredients. Cas A has dispersed about 10,000 Earth masses worth of sulfur alone, and about 20,000 Earth masses of silicon. The iron in Cas A has the mass of about 70,000 times that of the Earth, and astronomers detect a whopping one million Earth masses worth of oxygen being ejected into space from Cas A, equivalent to about three times the mass of the Sun. (Even though oxygen is the most abundant element in Cas A, its X-ray emission is spread across a wide range of energies and cannot be isolated in this image, unlike the other elements that are shown.) Astronomers have found other elements in Cas A in addition to the ones shown in this new Chandra image. Carbon, nitrogen, phosphorus and hydrogen have also been detected using various telescopes that observe different parts of the electromagnetic spectrum. Combined with the detection of oxygen, this means all of the elements needed to make DNA, the molecule that carries genetic information, are found in Cas A. |
|
|
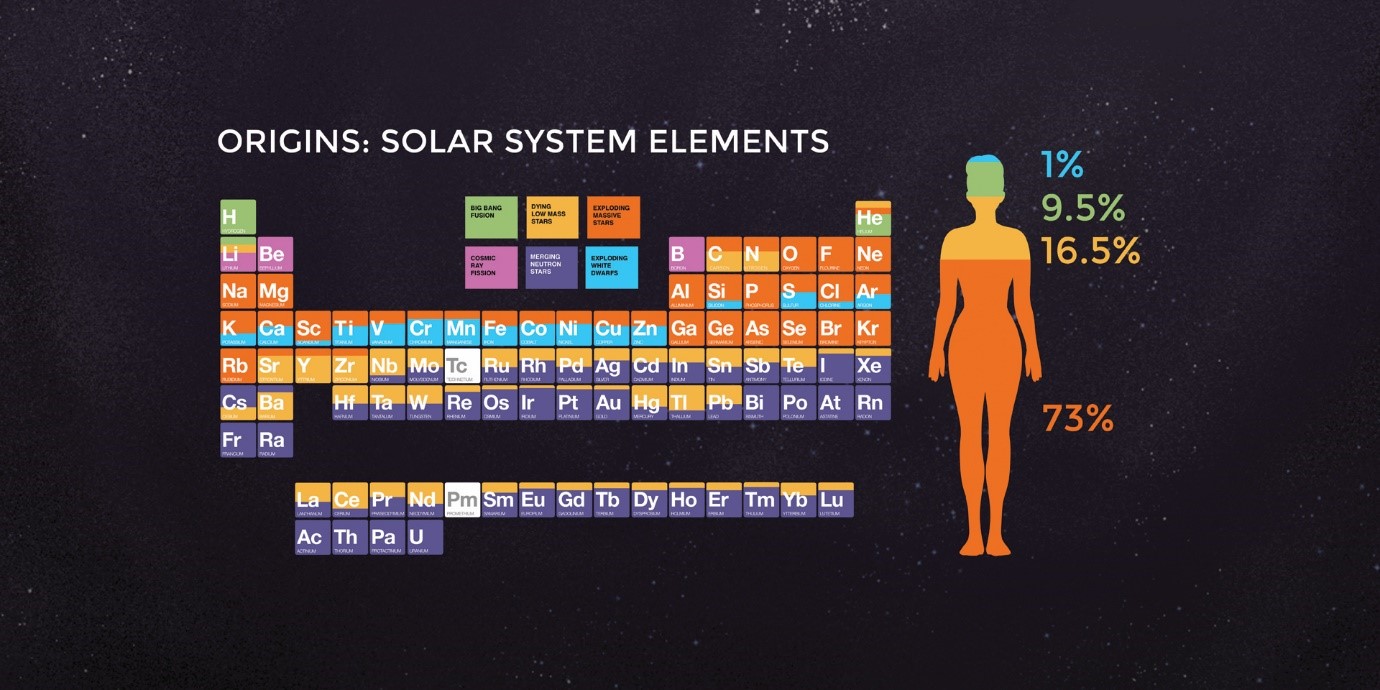
Periodic Table of the Elements. Credit: NASA/CXC/K. Divona; Reference: Science Blog from the SDSS, Origin of the Elements in the Solar System by Jennifer Johnson |
|
|
Oxygen is the most abundant element in the human body (about 65% by mass), calcium helps form and maintain healthy bones and teeth, and iron is a vital part of red blood cells that carry oxygen through the body. All of the oxygen in the Solar System comes from exploding massive stars. About half of the calcium and about 40% of the iron also come from these explosions, with the balance of these elements being supplied by explosions of smaller mass, white dwarf stars. While the exact date has not been confirmed, many experts think that the stellar explosion that created Cas A occurred around the year 1680 in Earth's timeframe. Astronomers estimate that the doomed star was about five times the mass of the Sun just before it exploded. The star is estimated to have started its life with a mass about 16 times that of the Sun, and lost roughly two-thirds of this mass in a vigorous wind blowing off the star several hundred thousand years before the explosion. Earlier in its lifetime, the star began fusing hydrogen and helium in its core into heavier elements through the process known as "nucleosynthesis." The energy made by the fusion of heavier and heavier elements balanced the star against the force of gravity. These reactions continued until they formed iron in the core of the star. At this point, further nucleosynthesis would consume rather than produce energy, so gravity then caused the star to implode and form a dense stellar core known as a neutron star. Chandra has repeatedly observed Cas A since the telescope was launched into space in 1999. The different datasets have revealed new information about the neutron star in Cas A, the details of the explosion, and specifics of how the debris is ejected into space. We’ve worked on these data and various ways to communicate them since then. We look forward to learning what else this fascinating object will teach us next about the cosmos and ourselves. |
|
|
Megan Watzke, Kimberly Arcand, and Peter Edmonds work in the Communications group for NASA’s Chandra X-ray Observatory. |
Eclipsed Moon and the Trisul Peak
By Ajay Talwar
|
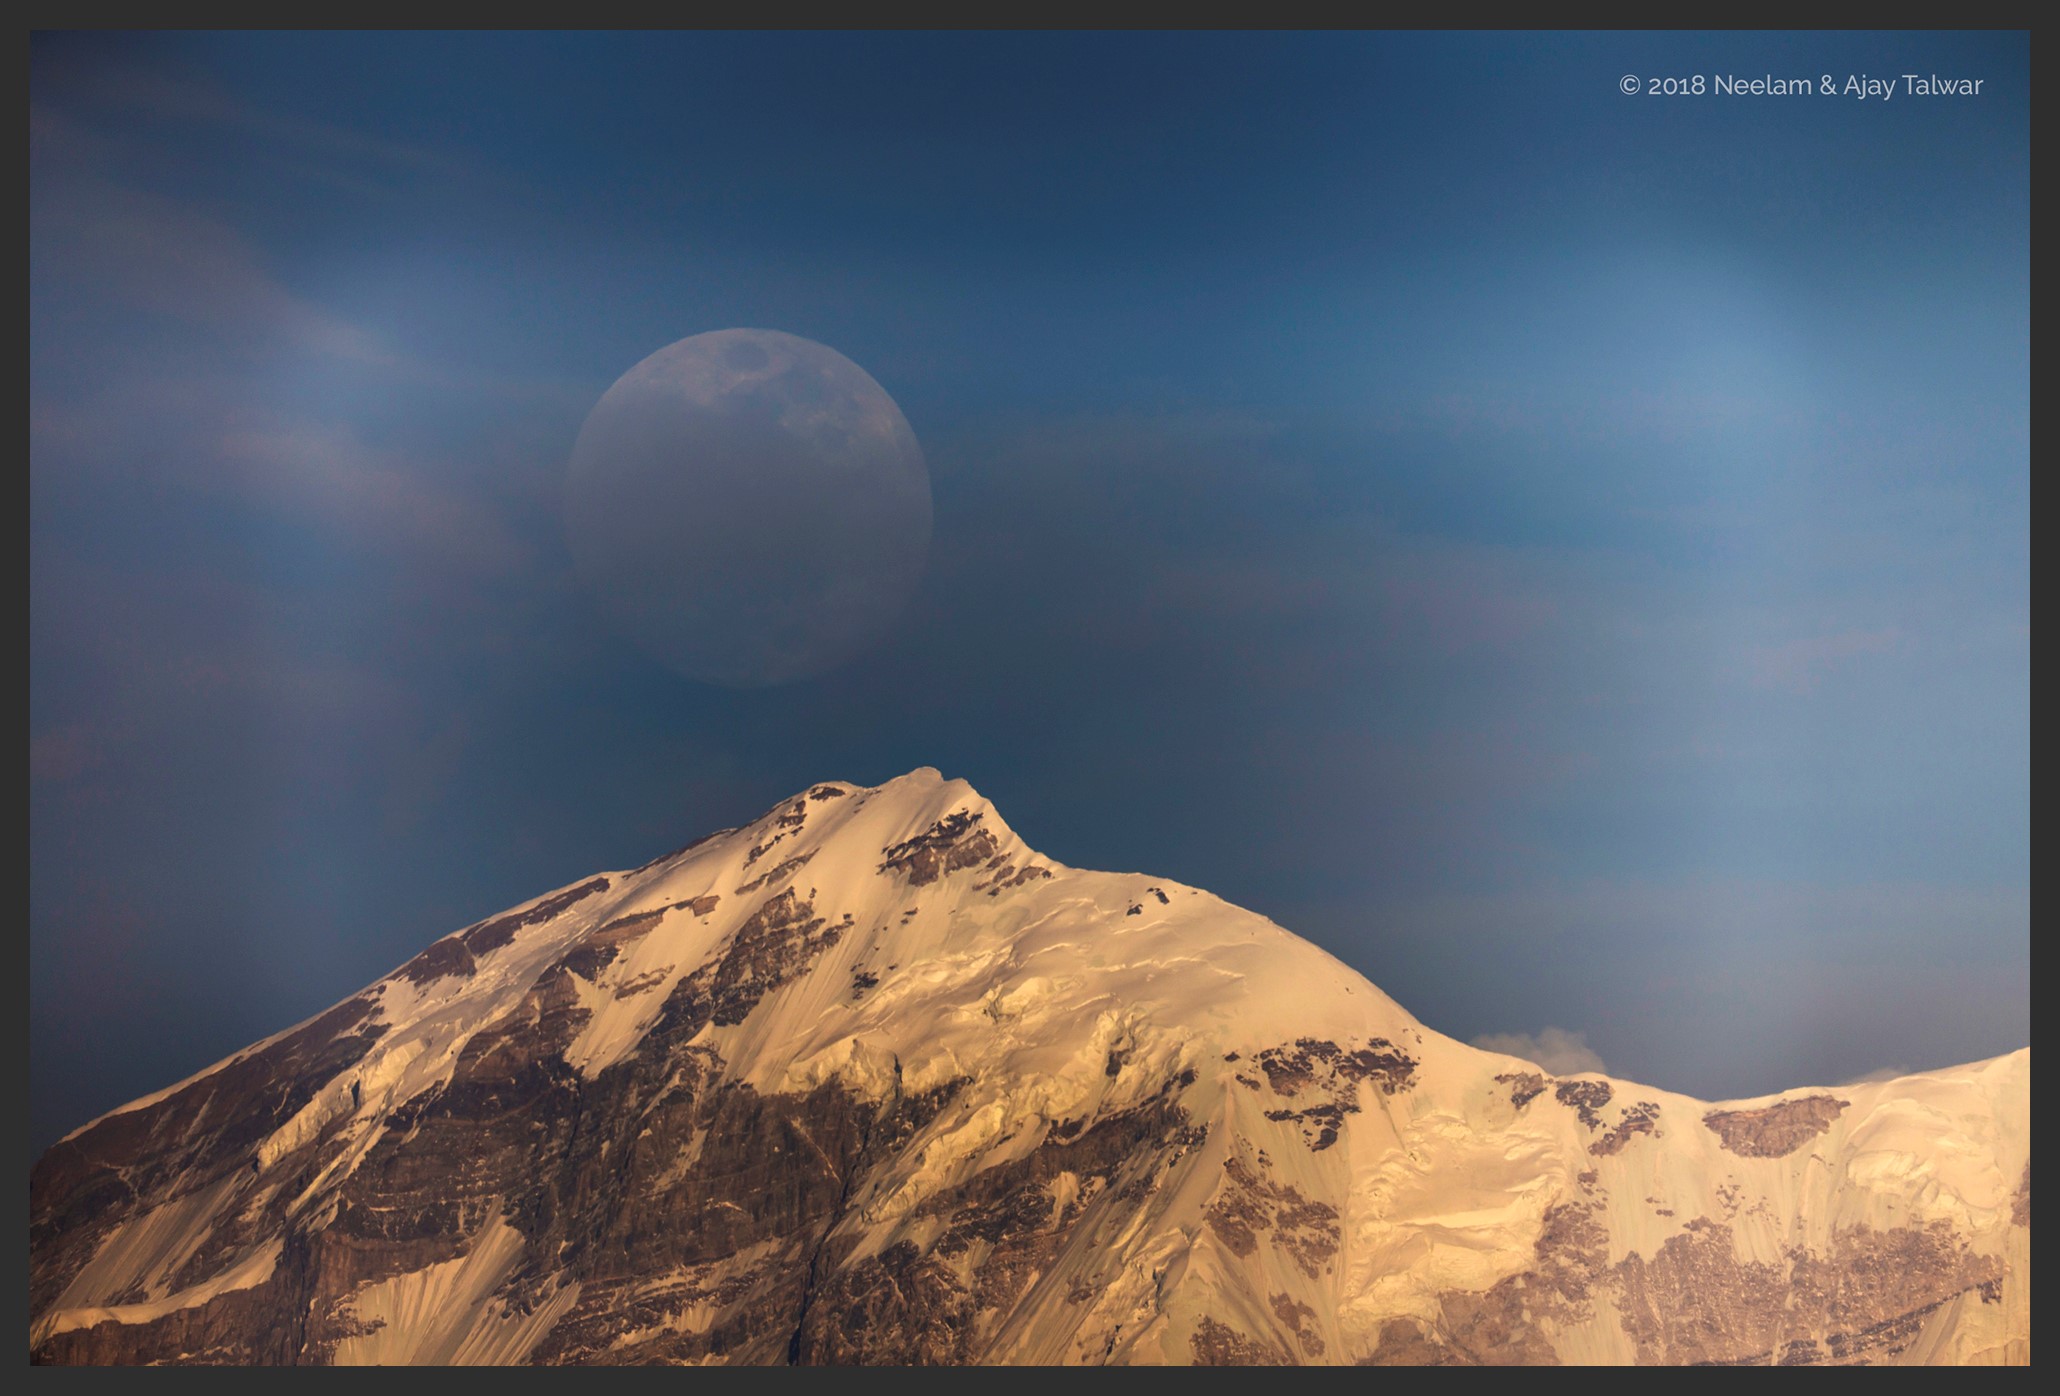
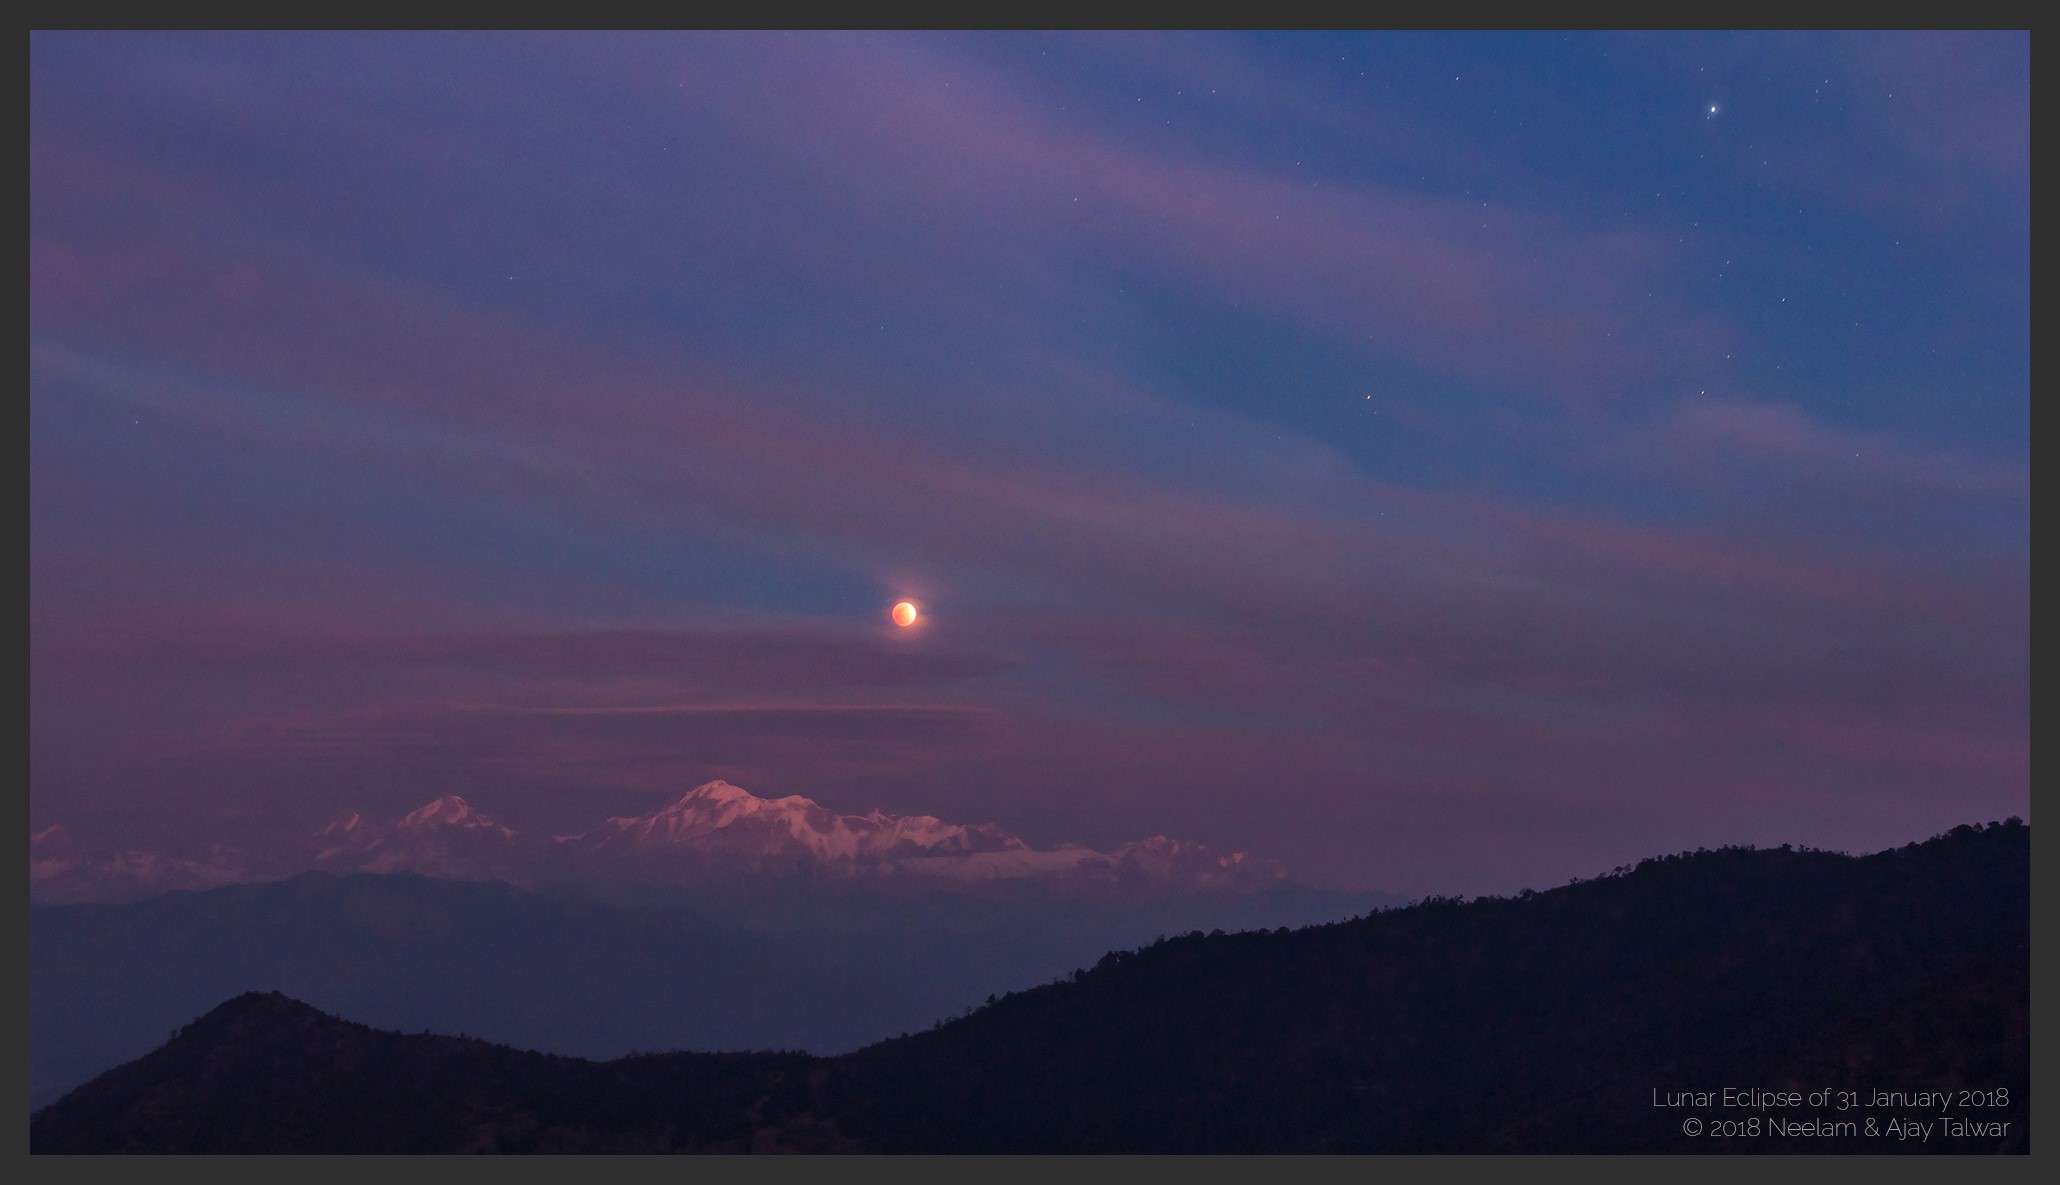
Recently the media has gone ga-ga over the ‘Super Blue Blood Moon’. In the days before the eclipse, the media frenzy was climbing higher and higher in India. I personally abhor the term Blood Moon. It’s an eclipse, turns red due to well-known reasons and if seen from a dark location, is of a beautiful colour, nothing to do with blood. Astrologers in India garnered a lot of attention and money by fooling people with dire consequences using this opportunity, as always and helped by the media having the same purpose. The juxtaposition of astrologers and electronic media benefitted both these charlatans. Lunar Eclipse Family ExpeditionMe and my family were more interested in the juxtaposition of the rising eclipsed Moon and a prominent peak in the Himalayas. Our planning started off many moons (months) ahead of the eclipse date – 31st January 2018. Location selection was the main criteria to put the eclipsed moon behind a peak. Nanda Devi is a celebrated, revered, high peak in the Indian Himalayas. Initially, we tried to find a place from where we could shoot the Moon behind Nanda Devi. Unfortunately, Nanda Devi cannot be seen from such a location because it gets behind the Trisul Massif. We shifted our focus from Nanda Devi to Trisul peak. |
|
The key factor in our family expedition was the location, or rather finding the perfect location which would provide a clear unobstructed landscape view of the Trisul. The other condition was that on 31st January the direction of celestial object Moon should match with the terrestrial Trisul Massif. Several websites and apps are available to locate just the location. One such software is Peakfinder. But when you actually try to find a good location using this software, you quickly get lost. The Himalayas are a vast place, even on the map. Eventually, we were helped by the friendly people of The Himalayan Group on Facebook. The collective knowledge experience of this group is tremendous. |
|
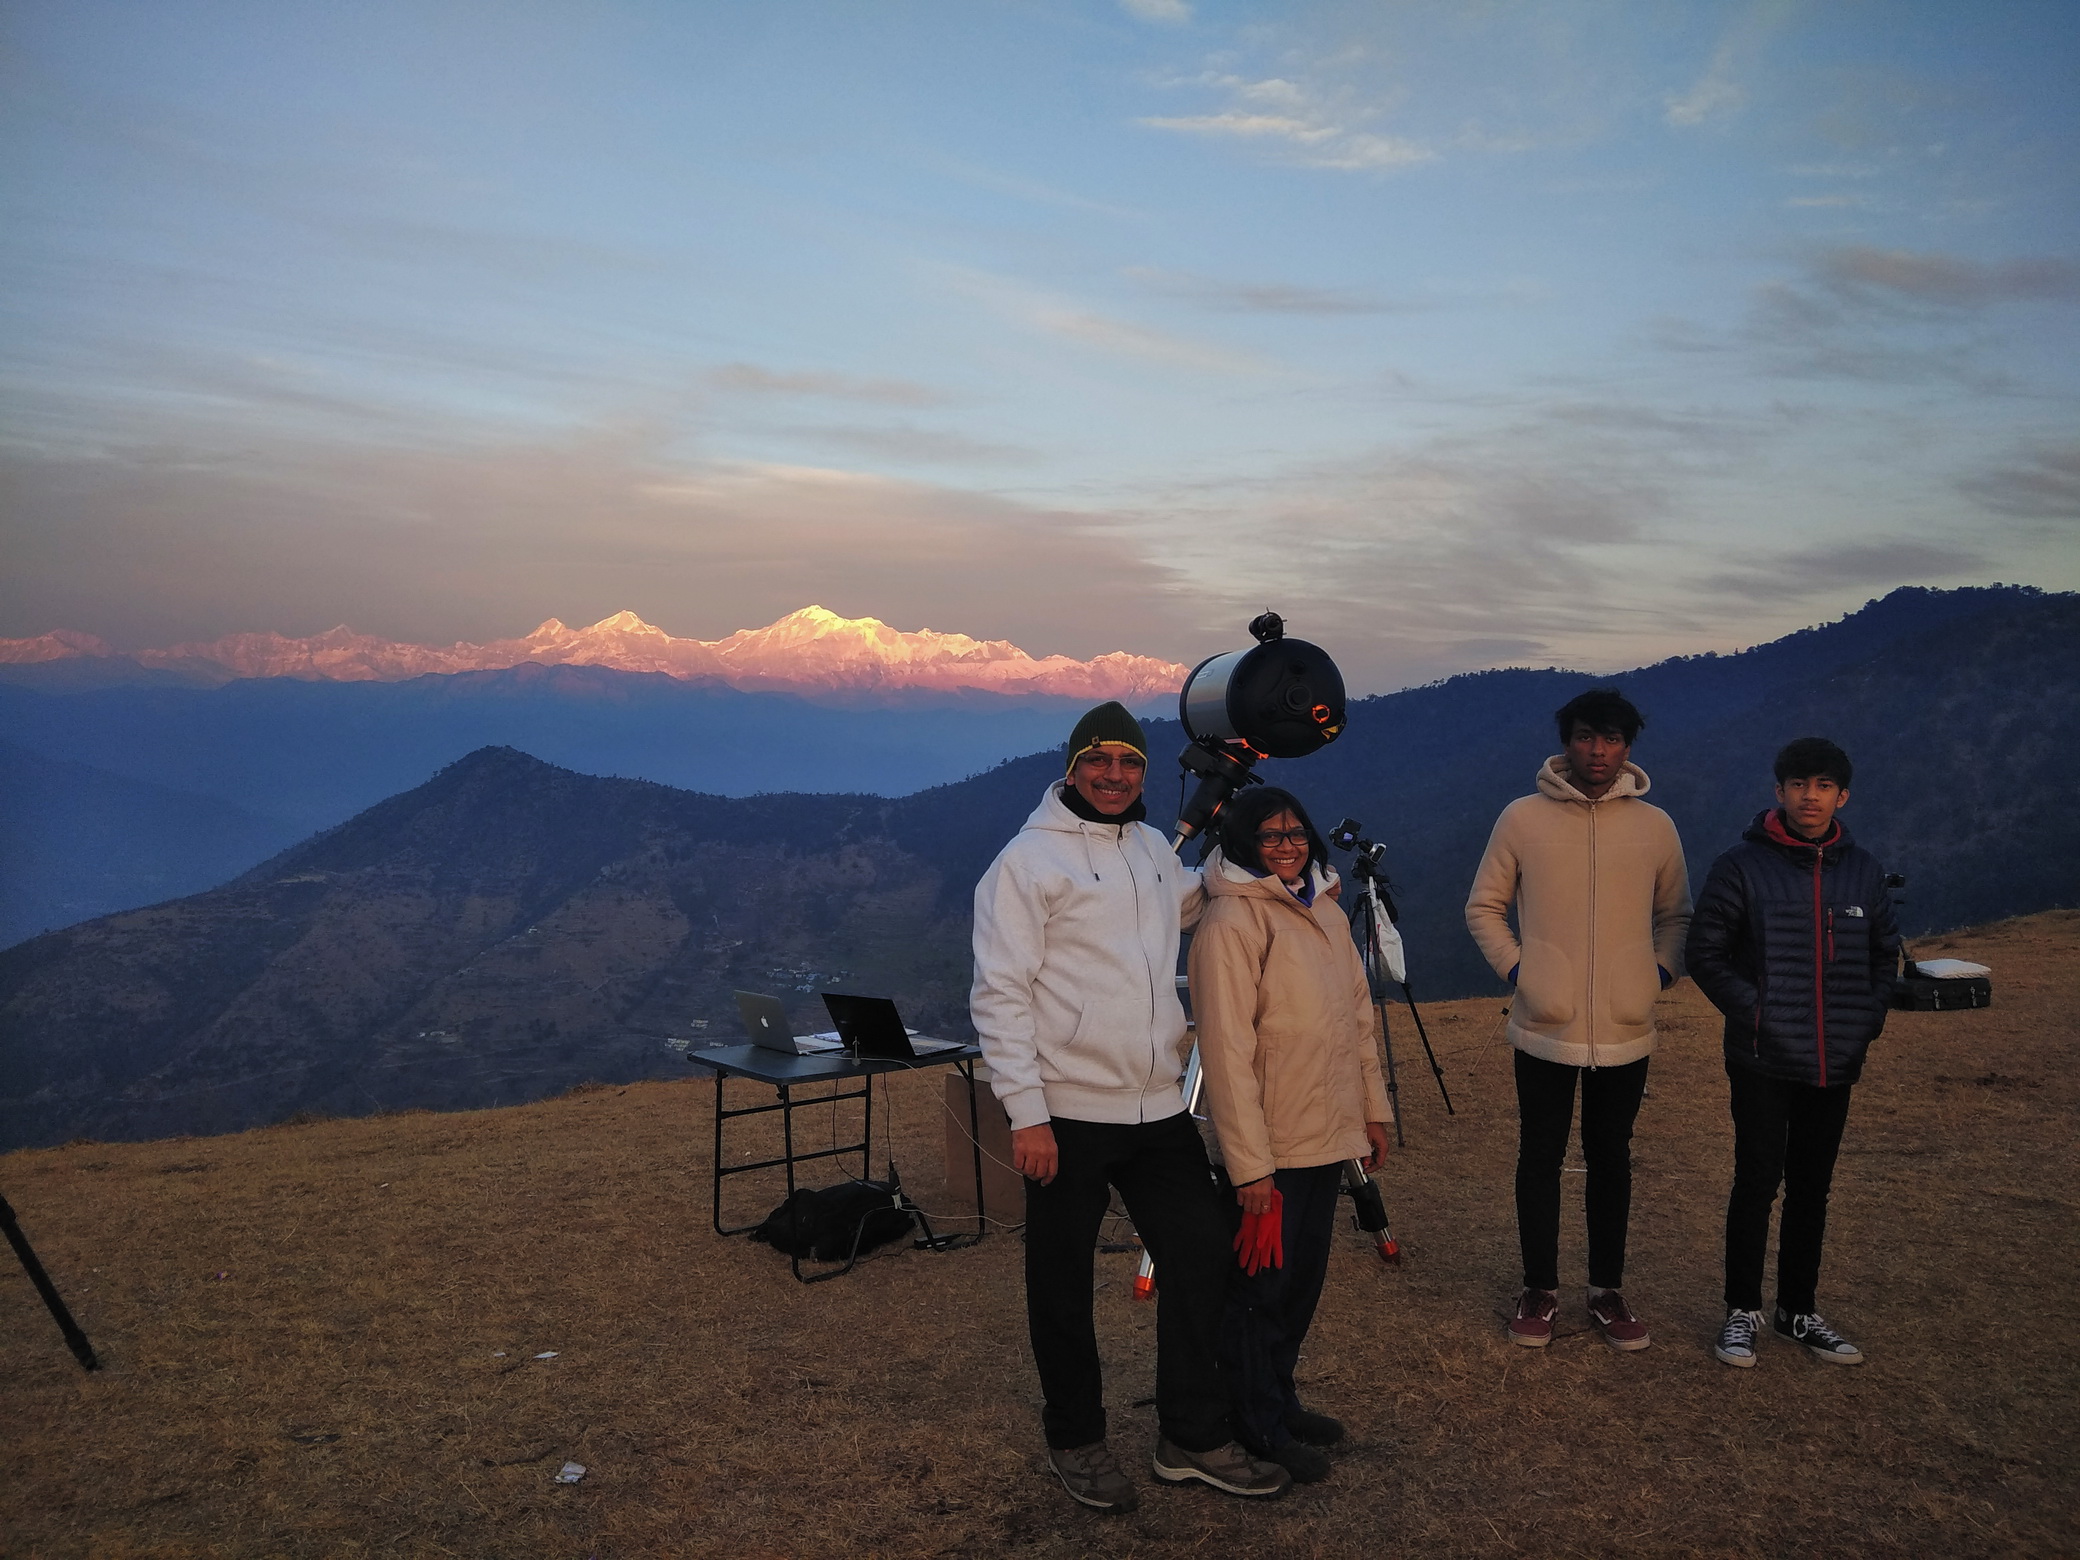
We found Benital. A small lake, a flat meadow near the well-known religious town of Karnaprayag. It was calculated to be a perfect location to observe and photograph the juxtaposition of Moon and Trisul together. Benital is not very high, less than 7000 feet. It’s an open level meadow, lots of clean flat space. We reached this wonderous place well ahead of time, one day earlier from the date of the eclipse. What a panoramic view! 120 degrees of Snow-capped Himalayan peaks starting from Bandarpunch to Trisul and Tharkot spread before us. Chaukhamba peaks exactly towards the north and the highest one Trisul I and Trisul II. All four of the family worked towards shooting the location, moonrise one day before and finally on the day of the eclipse. There were a lot of clouds on the peak on the day of the eclipse, but we kept on shooting and some time later, when the Moon was totally eclipsed it appeared gloriously between the clouds. |
|
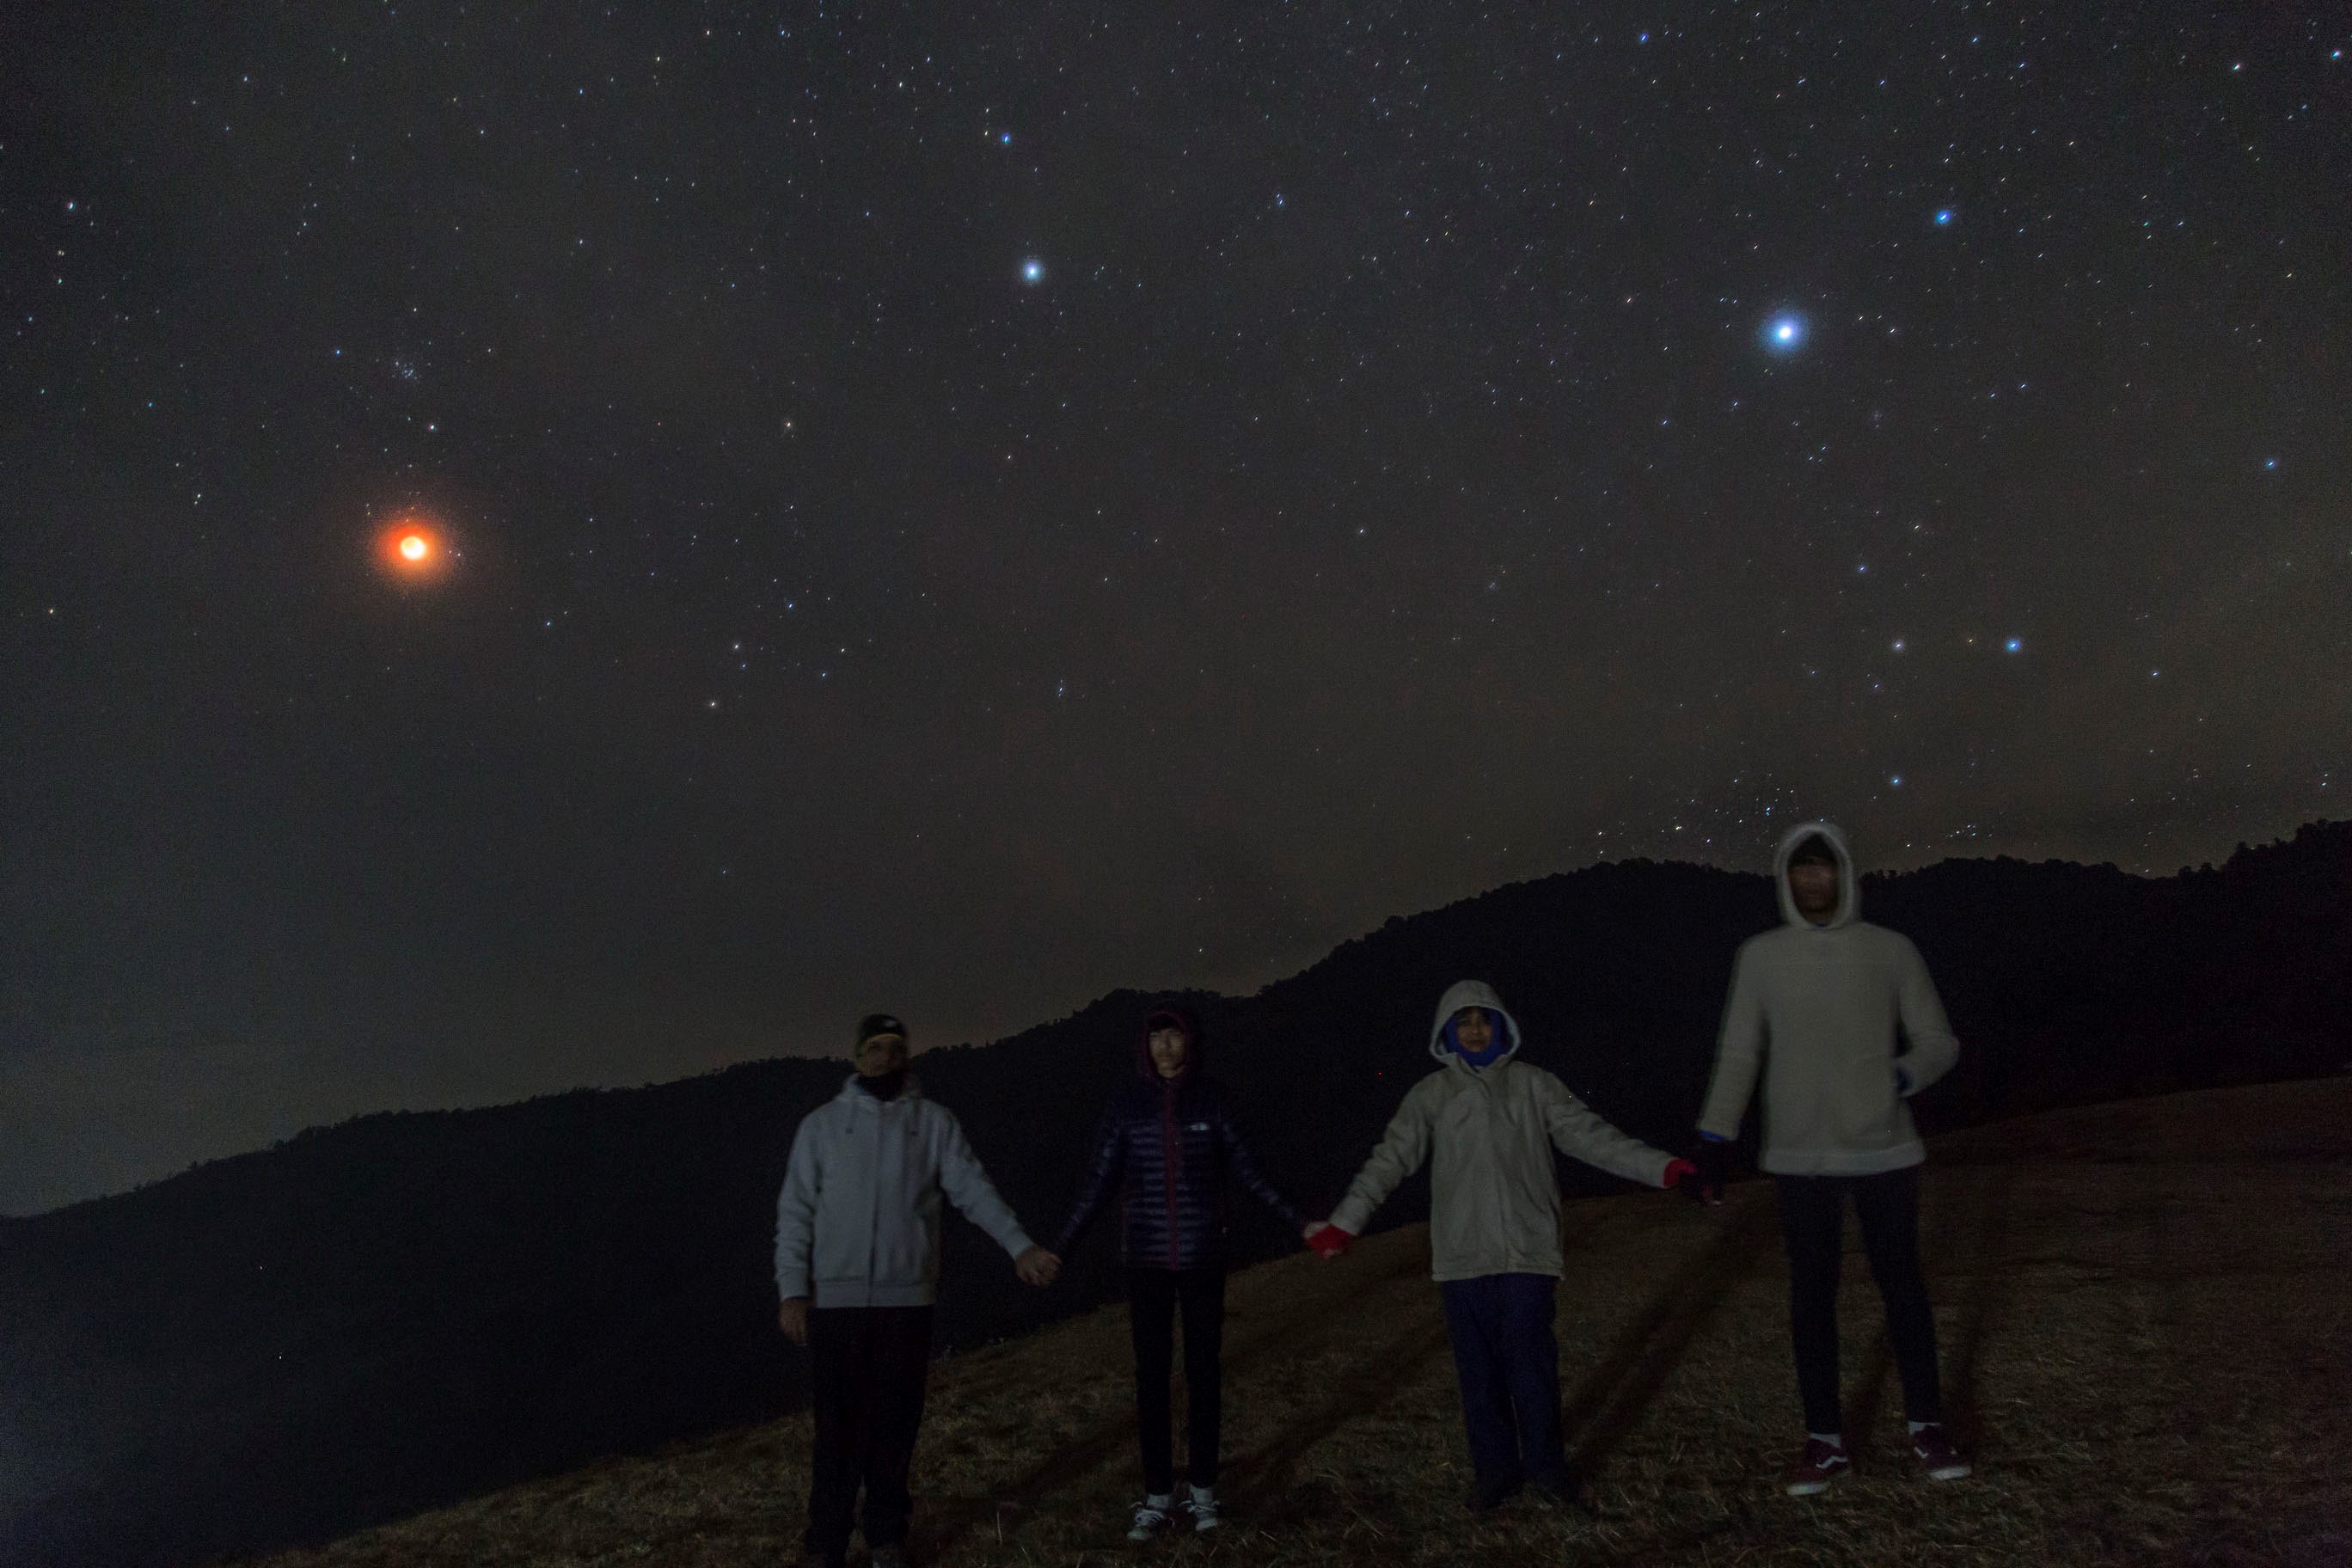
Two days later we were rewarded with our image published on the Astronomy Picture of the Day. Back home we worked on creating a 10 minute movie. The movie was selected to be screened at the 2018 Mountain Film Festival (Indian Mountaineering Foundation). This is a completely homebrewed movie. It was made by teenagers Nakul & Arjune, Neelam and myself. Nakul flew all the drone flights and shot the videos at all locations. More importantly, he planned all shots before each flight. Arjune has burned the midnight LED and completely build up all musical notes from scratch. Arjune also shot several time-lapse sequences at Benital. Neelam and I have gathered video, still and time-lapse footage. The movie has 4 sections - reaching Benital via Alaknanda and Pinder, setting up camp at Benital, a day before the eclipse the Moon rose behind Trisul. On the eclipse evening we had a lot of clouds, and though we were not able to capture the eclipsed Moon behind Trisul II, we did get to capture the Crimson Eclipsed Moon a while later. In some of the shots, you can see the Beehive cluster of stars nearby the eclipsed Moon. Please see the movie at this link. |
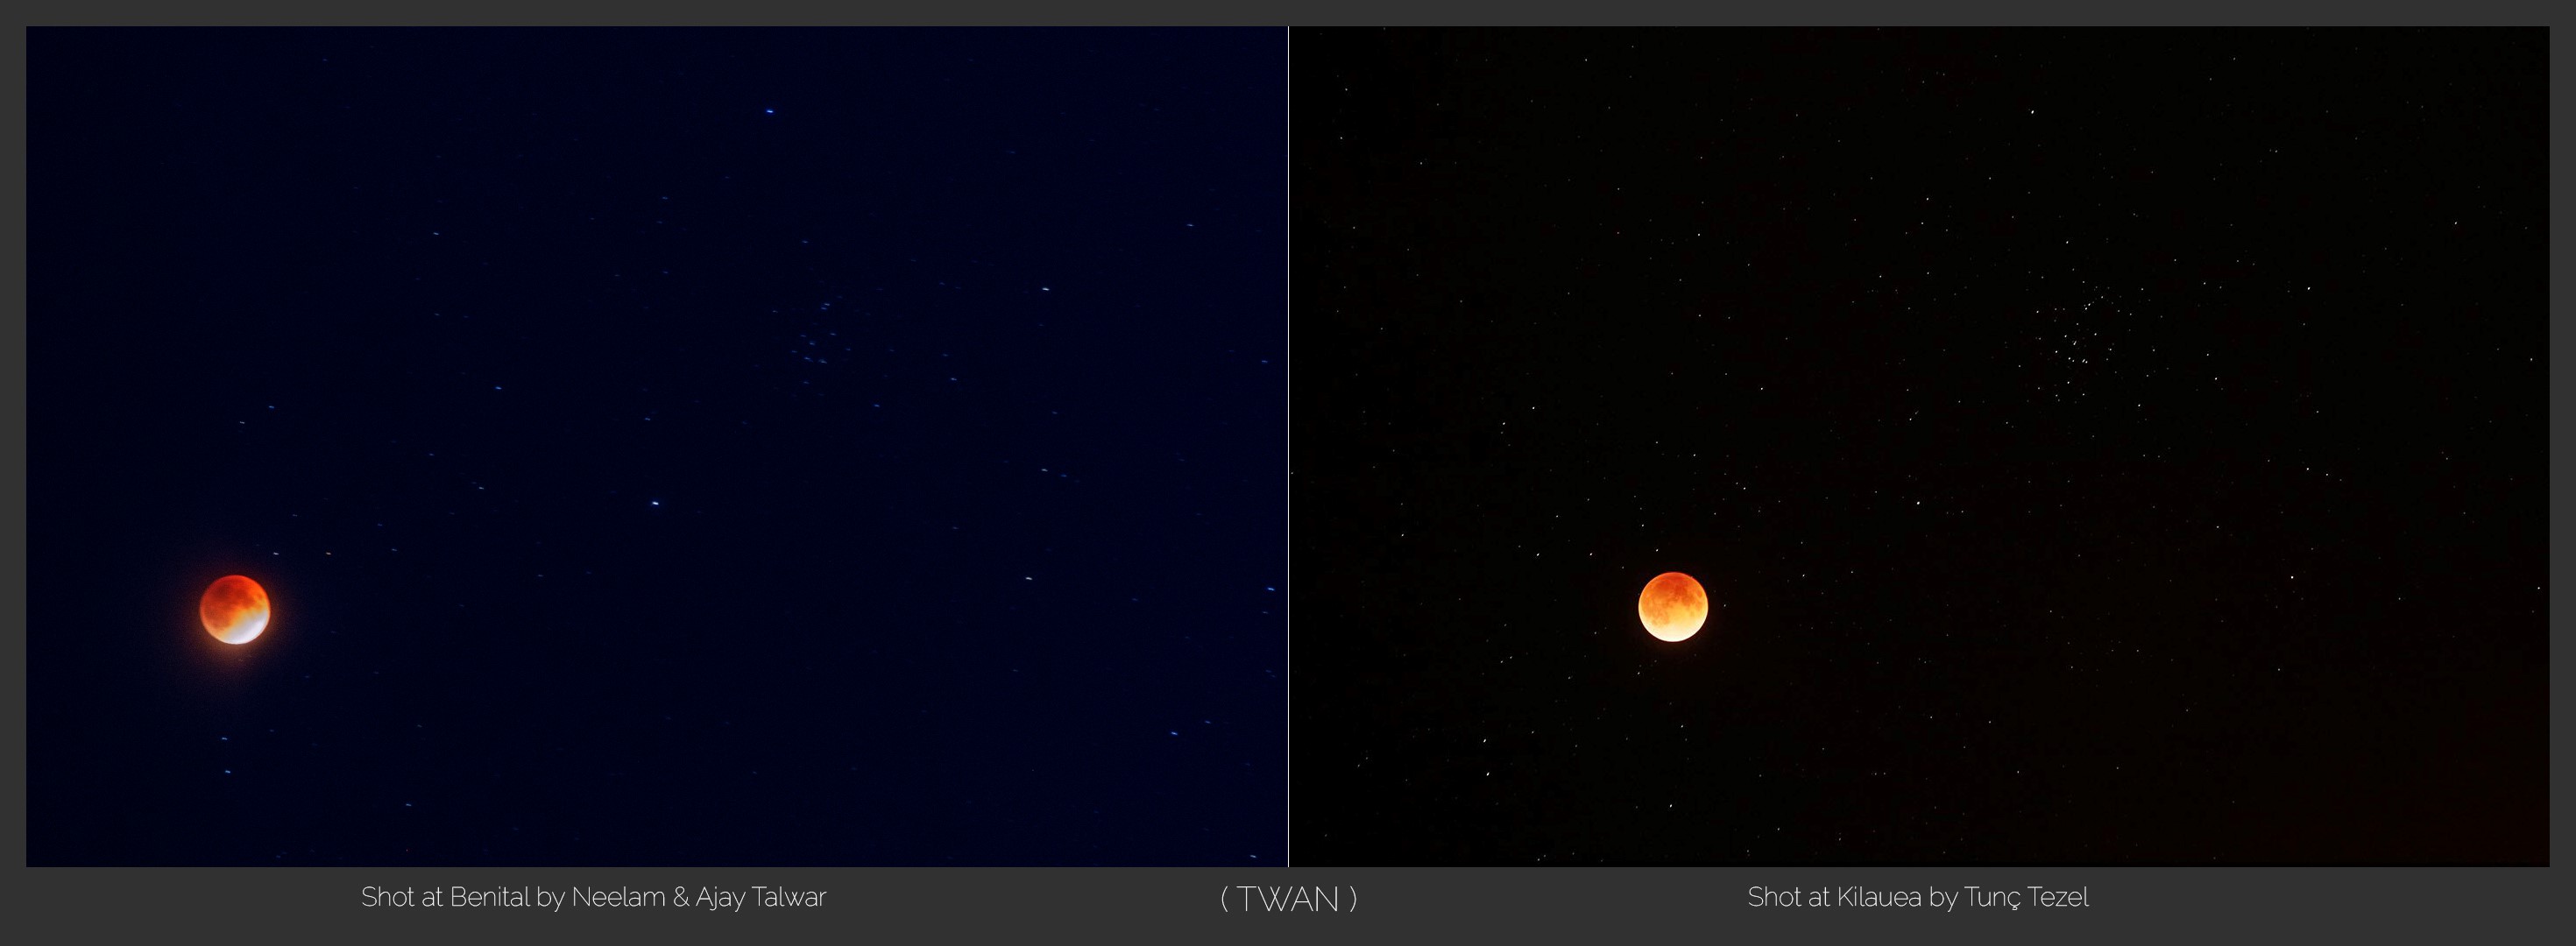
Eclipse From The Ends Of The EarthEnlarge the image to fill the screen. Squint your eyes to match the two eclipsed Moons, let your eyes get comfortable for a few seconds and then watch the Moon hanging much in front of the Beehive cluster, far behind. These images have been clicked from the ends of the Earth at the same time, On the right is the image shot by Tunç Tezel from Kilauea, Hawaii and on the left is the image shot by Neelam & Ajay from Benital in India. |
|
Ajay Talwar, TWAN photographer from India hopes to photograph the many natural and historical wonders in India at night under the stars. During his school days, Ajay Talwar was always working on some science projects. He had built a simple telescope with a cardboard and lenses bought at the flea market. During college days in 1985-86, Comet Halley was visible in the skies. Ajay visited a place called Ganga Sagar about a hundred kilometres from Calcutta and saw the comet very nicely from that remote place. His interest in astronomy was ignited on that trip. Ajay took up astrophotography because it was difficult and not many people were pursuing it. It was taken as a challenge, astrophotography used to be quite difficult with film cameras. With the advent of digital cameras, astrophotography became easy, primarily because the results are instantaneous, and one could correct a mistake right away. In the film days correcting a mistake was a process which took a month or two! |
 |
|
Recently his TWAN style work was exhibited at a pan India festival of photography in public spaces called “Fete de la Photo” organised by the French Cultural Institute in India. The exhibition ran in eight cities across India. Sky Photo Trip – is the name of the astrophotography workshop that he conducts in the Himalayas regularly. Ajay lives in Gurgaon a suburb of New Delhi, but his heart lives in the Himalayas where stars shine brightly, from Nanda Devi to the zenith. |
|
The Many Ways We Find Water on the Moon
By Joshua Bandfield
In the past decade, there have been a lot of water-on-the-Moon discoveries reported in scientific journals and making their way into the popular news. With new and highly capable spacecraft missions, we have been seeing the Moon in a new light (literally! – given the expansive wavelength coverage of the spacecraft measurements). We are also revisiting samples returned from the Apollo and Luna missions using extraordinarily detailed lab measurements to glean new insights about the Moon. What's remarkable is that as we approach the half-century mark after Apollo, we are still making fundamental discoveries about the Moon, and often using samples collected decades ago.
For years it seemed like we “discovered” water on Mars about once every six months or so, but recently it has been the Moon's turn under this particular spotlight. The reason for all the excitement is that water is so fundamental to many processes that we are so keenly interested in. How did the water get there? That's what we're trying to sort out and there are a couple of possibilities.
One possibility is that the water has always been there. Most of us had thought the Moon was relatively dry, with most water driven off in the aftermath of the giant impact with Earth that is thought to have formed the Moon. However, scientists have recently measured lunar samples with highly sensitive instruments, finding tiny amounts of water trapped in crystals. This indicates the Moon's crust and mantle started out with more water than previously thought. Water plays a big role in how rocks melt and crystallize and, if it is concentrated enough, can also make dramatic explosive volcanoes much more common.
Much higher abundances of ice have been found at the lunar poles, deep within craters where the sun never makes it above the crater rim. These regions are continuously cold (–200°C !), keeping water and other compositions, such as sulfur and organic molecules, stable. We think these deposits have been slowly accumulating throughout much of the history of our solar system. That's one of the reasons they are so interesting; these cold craters serve as a sort of witness plate experiment that has been running for billions of years. How does the water get there? Well...it's complicated, but one way to do it is via comets and asteroids, which vaporize when they impact the Moon. Most of the water escapes to space, but small amounts land on these cold surfaces and are trapped.
Finally, spacecraft measurements show evidence for minuscule amounts of water covering vast regions of the Moon. This water can form from the solar wind, which contains charged hydrogen atoms. When the hydrogen collides with the lunar surface, it breaks and damages the crystals that make up lunar soil and rocks, composed mainly of silicon, oxygen, iron, calcium, and magnesium. Any oxygen that is broken free will quickly find hydrogen to combine with, forming water (and other compositions, such as OH – hydroxyl).
So, depending on where and how we measure it, water on the Moon can tell us very different stories. In one case, it is perhaps a vestige of the Moon's violent origin. In another, it may be a record of comets and asteroids over billions of years. And lastly, it can be forming today from material streaming off our sun and colliding with the lunar surface. It is remarkable how something as seemingly simple as water can point to such a rich and varied set of processes that have shaped the Moon throughout its history.
|
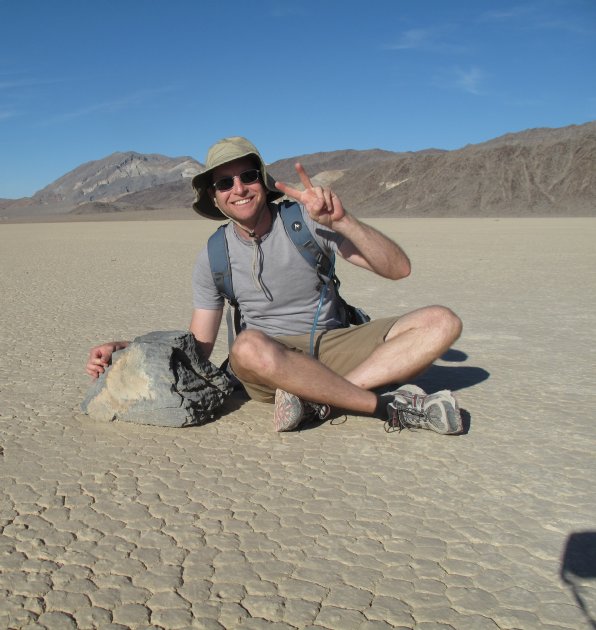
Joshua Bandfield is a Senior Research Scientist for Space Science Institute and investigates the compositions and landscapes of planetary bodies throughout the solar system. He uses infrared measurements and images returned from orbiting spacecraft and landers to determine the properties of planetary surfaces. He has been involved with spacecraft planning, operations, and science activities for NASA spacecraft since 1995. Josh is a geologist by training and likes rocks. |
 |
Preserve your Natural Heritage: Measure Sky Brightness on Moonless Evenings with Globe at Night Citizen-Science
By Connie Walker
Citizen-science is a rewardingly inclusive way to bring awareness to the public on the disappearance of the starry night sky, its cause and solutions. Globe at Night (GaN) encourages citizen-scientists worldwide to record the brightness of the night sky. During ten-days per month of moonless evenings, children and adults match the appearance of a specific constellation with 7 star maps of progressively fainter stars found at www.globeatnight.org. (Moonless evenings are chosen to avoid having a natural light bulb in the night sky when taking measurements.) People then submit their choice of star map in-situ using the “webapp” on a smart device. In twelve years of the program, over 175,000 observations from 180 countries have been contributed to a light pollution map.
Resources for GaN exist to make participation easy. There are 4 ways of taking measurements. The online app for data reporting is in 26 languages. On-the-fly mapping enables citizen-scientists to see observations immediately. STEM activities for young children and problem-based learning activities for older students were created to experience real-life scenarios: role-playing sea turtles hatching (misdirected by lights on shore) or analyzing an ISS image of Houston to estimate the wasted energy, cost and carbon footprint. In-situ and online workshops have been given on using GaN, as well as the activities. Our Facebook page exists to encourage dialogue and bring cutting-edge news. To entice interest, we had monthly newsletters and serial podcasts starring the Dark Skies Crusader.
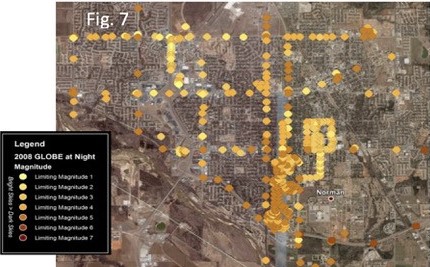
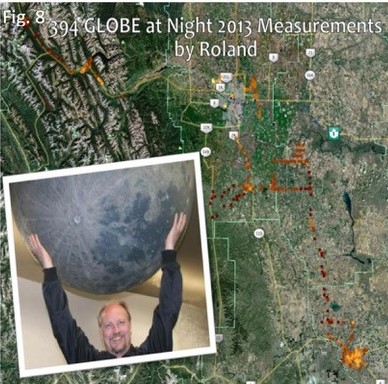
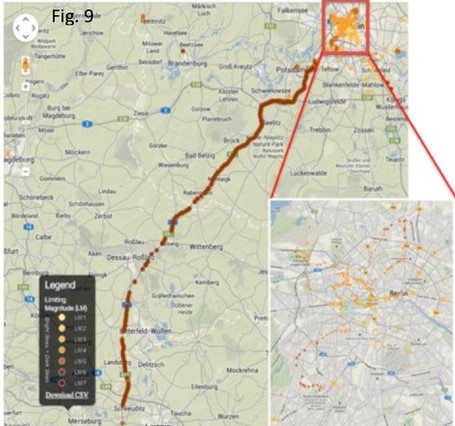
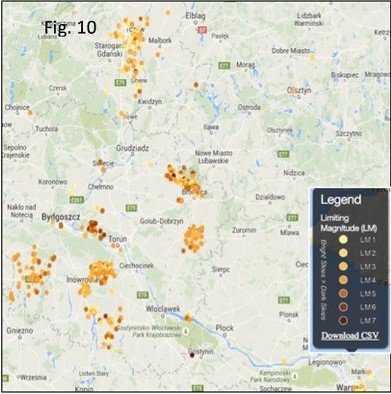
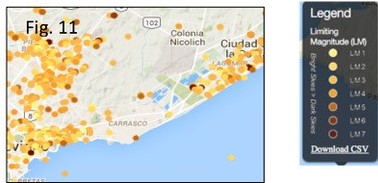
There are many potential uses of the open Globe at Night database. Participants can explore the last 12 years of data using the Globe at Night interactive map or see how many measurements are from a particular city, using Globe at Night’s map app. The database has been used to explore how light pollution affects the foraging habits of bats using data from the Arizona Game and Fish (Fig. 1), or the habitats of night birds using data from the Audubon Society (Fig. 2). It also has been used by students to study different methods for studying night sky brightness (Fig. 3) or to study seasonal trends in nightly sky brightness averages within a city compared to mountaintop observatories (Fig. 4). The data was used to estimate how much brighter a city sky is than a naturally unpolluted starry sky. In Fig. 5, students visualized their 3700 Globe at Night data points as a 35,000 piece lego map, higher layers as higher limiting magnitudes. With their data, they calculated a factor of 9 compared with a limiting magnitude (LM) 6 sky. In Fig. 6, Tucson was a factor of 100 brighter compared with an LM 7 sky. Dark sky advocates in Figures 7 and 8 used measurements to strengthen lighting laws. Communities in Figures 9, 10 and 11 make a difference by monitoring their night sky brightness levels year after year.
We have built a community of practitioners in various ways worldwide and have metrics on behavioral changes. GaN has been part of special campaigns like with the National Park Service, the National Geographic BioBlitz and Tucson in 2011. In 2009 and 2015, Globe at Night was an official citizen-science campaign for the United Nation-sanctioned International Years of Astronomy and of Light, respectively, setting record participation. To maintain the community and create new partnerships, we have teamed with SciStarter to track participants via a dashboard, with the Girl Scouts and SciStarter in “Think Like a Citizen Scientist”, and with STARS4ALL’s Light Pollution Initiatives.
Globe at Night has provided the public with a variety of ways to be better stewards in lighting more responsibly to minimize the disappearance of our potentially starry night sky. Globe at Night is a flagship program of the National Optical Astronomy Observatory (NOAO). NOAO is the U.S. national observatory operated by the Association of Universities for Research in Astronomy, Inc. under cooperative agreement with the National Science Foundation.
We invite you to participate in Globe at Night this Global Astronomy month. We further invite you to join us all year next year for the International Astronomical Union’s 100th year anniversary by taking Global at Night measurements during any of the monthly 10-day campaigns. Your Globe at Night measurements will help make a difference in preserving our night sky heritage.
(See the photo montage that follows.)
 |
|
  |
|
 |
|
  |
|
  |
|
  |
|
 |
|
Image Credits:
Figure 1. Alisa Fersch (and Connie Walker)
Figure 2. Don Swann
Figure 3. John Kanemoto and Amy Juan (and Connie Walker)
Figure 4. Rachel Nydegger (and Connie Walker)
Figure 5 Chuck Bueter
Figure 6. Connie Walker and Jeremy White
Figure 7. Data taken by Eileen Gryzbowski and colleagues; map by Connie Walker
Figure 8. Roland Dechesne
Figure 9. Data taken by Chris Kyba; map by Connie Walker
Figure 10. Data taken by Astrobaza students in Poland; map by Connie Walker
Figure 11. Data taken by Montevideo, Uruguay residence; map by Connie Walker
Connie Walker is an astronomer at the National Optical Astronomy Observatory in Tucson, Arizona, USA. During the past 17 years, she has enjoyed directing several education outreach programs, such as the popular international light pollution citizen-science campaign Globe at Night and the middle school “problem-based learning” activities in the Quality Lighting Teaching Kit. She is vice-president of the International Astronomical Union’s commission on light pollution and chair of the education committee for the board of directors of the International Dark-Sky Association. For her efforts in bringing dark skies awareness to the public, the IDA awarded her their Hoag-Robinson Award in 2011.


